

OCTOBER UPDATE: Watching the Numbers
When I drafted the initial version of this blog in late September, I set out to provide visibility to the data being reported by the State of California in regards to the actual number of confirmed cases of COVID19 in Childcare centers across the state.
Based on the response and the subsequent wave of articles being published in various media that spans both sides of the political spectrum, I am more resolute than ever in my assertion that schools are safe, posing negligible risk to exposure of COVID, not to mention ZERO risk of death (thus far in Santa Clara County).
For more on the background, please refer to my initial blog on this topic.
Today we are jumping right into the numbers.
But first, a question: If you knew that there is a 99.96% chance of success at something that you wanted to do, would you do it?
We will come back to this question in a bit.
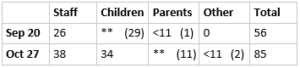
Confirmed Cases of COVID-19 in California Childcare Centers
(**) (<11) as I detail in the first blog, the state obscures data in the report using “<11” when there are less than 11 cases and “**” when there are less than 30 cases but more than 10. The numbers in parenthesis above are my calculations using these figures in combination with the unobscured data provided. I have skewed my estimates for the WORST possible scenario (i.e. the maximum number of children confirmed)
To review this data first hand click here and scroll down to COVID-19 Positive Cases in Child Care Facilities
The data shows an increase in the number of confirmed cases and at first pass it’s easy to say “oh my goodness, there was a 17% increase in the number of confirmed cases amongst children!”.
This is a classic trap that the media uses by manipulating data to justify more dramatic headlines.
Sample size matters.
Any time one uses percentages to perform qualitative analysis, the most important data point is the sample size.
For example, if your sample size is 3 children and one child is confirmed positive on the day you begin measuring, all it takes is for 1 more child to be confirmed and you suddenly have a 100% increase in confirmed cases – but only 1 additional confirmed case.
However a headline touting a “100% increase in confirmed cases!” or “The number of confirmed cases has DOUBLED!” drives far more of a reaction than the alternative “One more confirmed case!”.
The same number of children were confirmed in our example – but the headline using 100% Increase is used to get the attention of the reader.
So yes, there was a 17% increase in the number of children confirmed positive in October the total confirmed cases in children increased from 29 to 34, a total of 5 new cases.
Lets put those five cases into perspective:
But first let me ask again: if you knew that there is a 99.96% chance of success at something that you wanted to do, would you do it?
As of October 27th, there were 562 childcare centers open for business in Santa Clara County (this does not include the ~1200 home-based childcare centers in the county).
Since the exact number of children attending these centers is not published as part of this report, we will assume very conservatively that each center has an average of 20 children attending school each day.
This is a very conservative estimate as our four schools currently have 35+ children attending and most of the other childcare centers in the area have larger capacity than our schools.
Again: If you knew that there is a 99.96% chance of success at something that you wanted to do, would you do it?
Lets do some math
562 childcare centers X 20 children per center = 11,240 children currently attending childcare centers in Santa Clara County.
5 confirmed cases / 11,240 children = 0.04% (four one-hundredths of one percent) of children attending childcare centers were confirmed with COVID in October.
Let that sync in for a second: four one-hundredths of one percent.
Now consider this: if your child returned to preschool in October, there was a 99.96% chance that they will NOT catch COVID.
Lets go back to my original question: If you knew that there is a 99.96% chance of success at something that you wanted to do, would you do it? Of course you would. Most people would not even think twice.
Folks I know that many parents like yourselves have spent much of the last seven months reading the doom and gloom in the headlines. I personally believe that the media in our country has done no one any favors with their focus on grabbing headlines by playing games with percentages and the like.
At the end of my last blog on this topic, I made the following observation: “If children don’t begin returning (to school) soon, the numbers parents will begin to see increase quickly is the number of childcare centers closing and the cost of tuition at those that remain open.”
I hate it when I am right about things like this, but in the month of September 423 childcare providers CLOSED in the state of California.
While the closures were primarily among childcare home faculties, these small, family-owned businesses are an indicator of the health of the child care industry. They fill in the gaps in the marketplace particularly for infant and toddler aged children and are the first indication of the fate the rest of the industry faces unless more families return to school soon.
Since reopening on May 18th, The Montessori School of Silicon Valley has had ZERO confirmed cases in our schools.
So I will ask one last time: If you knew that there is a 99.96% chance of success at something that you wanted to do, would you do it?